Tested using Chrome 90.0.4430.85 (runtime settings).
| Metric | Value |
|---|---|
| Performance Score | 72 |
| Total Page Transfer Size | 1.3 MB |
| Requests | 105 |
| TTFB [median] | 159 ms |
| Fully Loaded [median] | 2.434 s |
| First Visual Change [median] | 573 ms |
| First Contentful Paint (FCP) [median] | 556 ms |
| Largest Contentful Paint (LCP) [median] | 556 ms |
| Cumulative Layout Shift (CLS) [median] | 0.04 |
| Total Blocking Time [median] | 407 ms |
| Max Potential FID [median] | 193 ms |
| CPU long tasks [median] | 13 |
| CPU longest task duration | 329 ms |
| Speed Index [median] | 620 ms |
| Visual Complete 85% [median] | 674 ms |
| Visual Complete 99% [median] | 1.900 s |
| Last Visual Change [median] | 2.400 s |
| Metric | min | median | mean | max |
|---|---|---|---|---|
| Visual Metrics | ||||
| SpeedIndex | 509 ms | 620 ms | 627 ms | 751 ms |
| FirstVisualChange | 467 ms | 573 ms | 583 ms | 710 ms |
| LastVisualChange | 2.161 s | 2.400 s | 2.352 s | 2.494 s |
| VisualReadiness | 1.451 s | 1.921 s | 1.768 s | 1.933 s |
| VisualComplete85 | 533 ms | 674 ms | 682 ms | 839 ms |
| VisualComplete95 | 533 ms | 674 ms | 682 ms | 839 ms |
| VisualComplete99 | 1.645 s | 1.900 s | 1.845 s | 1.989 s |
| RUM Metrics | ||||
| TTFB | 130 ms | 159 ms | 181 ms | 253 ms |
| LCP | 454 ms | 556 ms | 576 ms | 717 ms |
| FCP | 454 ms | 556 ms | 576 ms | 717 ms |
| firstPaint | 454 ms | 556 ms | 576 ms | 717 ms |
| loadEventEnd | 1.995 s | 2.169 s | 2.201 s | 2.438 s |
| CLS | 0.0444 | 0.0444 | 0.0444 | 0.0444 |
| User Timing | ||||
| mwStartup | 521 ms | 630 ms | 697 ms | 939 ms |
| mwCentralNoticeBanner | 2.011 s | 2.268 s | 2.201 s | 2.326 s |
| CPU | ||||
| Total Blocking Time | 364 ms | 407 ms | 409 ms | 457 ms |
| Max Potential FID | 103 ms | 193 ms | 167 ms | 205 ms |
| CPU long tasks | 12 | 13 | 13 | 14 |
Run 3 SpeedIndex median
Use--filmstrip.showAll to show all filmstrips.
 0 s0.4 sCPU Long Task duration 123 ms
 0.6 sFirst Contentful Paint 556 msLCP <P> 556 msFirst Visual Change 573 ms
 0.7 smwStartup 630 msVisual Complete 85% 674 msVisual Complete 95% 674 ms
 0.8 s1 sCPU Long Task duration 51 ms1.2 sCPU Long Task duration 65 msCPU Long Task duration 60 ms1.3 sCPU Long Task duration 56 ms1.4 sCPU Long Task duration 61 ms1.5 sCPU Long Task duration 76 ms1.6 sCPU Long Task duration 117 ms1.7 sCPU Long Task duration 69 ms1.9 sCPU Long Task duration 97 ms
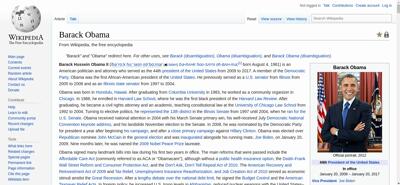 2 sVisual Complete 99% 1.989 sDOM Content Loaded Time 1.996 s
 2.1 sCPU Long Task duration 205 ms2.4 smwCentralNoticeBanner 2.326 sCPU Long Task duration 69 ms
 2.5 sLayout Shift 0.04424 2.417 sPage Load Time 2.438 sLayout Shift 0.00016 2.449 sLast Visual Change 2.494 s
The coach helps you find performance problems on your web page using web performance best practice rules. And gives you advice on privacy and best practices.

| Title | Advice | Score |
|---|---|---|
| Use a good Content-Security-Policy header to make sure you you avoid Cross Site Scripting (XSS) attacks. (contentSecurityPolicyHeader) | Set a Content-Security-Policy header to make sure you are not open for Cross Site Scripting (XSS) attacks. You can start with setting a Content-Security-Policy-Report-Only header, that will only report the violation, not stop the download. | 0 |
| Description: Content Security Policy is delivered via a HTTP response header, and defines approved sources of content that the browser may load. It can be an effective countermeasure to Cross Site Scripting (XSS) attacks and is also widely supported and usually easily deployed. https://scotthelme.co.uk/content-security-policy-an-introduction/. | ||
| Offenders: | ||
| Set a referrer-policy header to make sure you do not leak user information. (referrerPolicyHeader) | Set a referrer-policy header to make sure you do not leak user information. | 0 |
| Description: Referrer Policy is a new header that allows a site to control how much information the browser includes with navigations away from a document and should be set by all sites. https://scotthelme.co.uk/a-new-security-header-referrer-policy/. | ||
| Offenders: | ||
| Page info | |
|---|---|
| Title | Barack Obama - Wikipedia |
| Generator | MediaWiki 1.37.0-wmf.6 |
| Width | 1350 |
| Height | 40983 |
| DOM elements | 18960 |
| Avg DOM depth | 14 |
| Max DOM depth | 29 |
| Iframes | 0 |
| Script tags | 6 |
| Local storage | 611.5 KB |
| Session storage | 0 b |
| HTML vs AMP | Plain good HTML page |
| Resource Hints |
|---|
| dns-prefetch |
| https://login.wikimedia.org/ |
| https://meta.wikimedia.org/ |
| preconnect |
| https://upload.wikimedia.org/ |
Data collected using Wappalyzer. Use --browsertime.firefox.includeResponseBodies htmlor --browsertime.chrome.includeResponseBodies htmlto help Wappalyser find more information about technologies used.
| Technology | Confidence | Category |
|---|---|---|
| MediaWiki | 100 | Wikis |
| PHP | 100 | Programming languages |
| Bootstrap 2 | 100 | UI frameworks |
| jQuery | 100 | JavaScript libraries |
| Visual Metrics | |
|---|---|
| First Visual Change | 573 ms |
| Speed Index | 620 ms |
| Visual Complete 85% | 674 ms |
| Visual Complete 95% | 674 ms |
| Visual Complete 99% | 1.989 s |
| Last Visual Change | 2.494 s |
| Visual Readiness | 1.921 s |
| Navigation Timing | |
|---|---|
| backEndTime | 253 ms |
| domContentLoadedTime | 1.996 s |
| domInteractiveTime | 1.995 s |
| domainLookupTime | 2 ms |
| frontEndTime | 1.092 s |
| pageDownloadTime | 1.092 s |
| pageLoadTime | 2.438 s |
| redirectionTime | 0 ms |
| serverConnectionTime | 93 ms |
| serverResponseTime | 1.233 s |
| Google Web Vitals | |
|---|---|
| First Contentful Paint (FCP) | 556 ms |
| Largest Contentful Paint (LCP) | 556 ms |
| Cumulative Layout Shift (CLS) | 0.04 |
| Total Blocking Time (TBT) | 407 ms |
| Extra timings | |
|---|---|
| First Contentful Paint (FCP) | 556 ms |
| First Paint | 556 ms |
| Largest Contentful Paint (LCP) | 556 ms |
| Load Event End | 2.438 s |
| Fully loaded | 2.503 s |
| User Timing marks | |
|---|---|
| mwStartup | 630 ms |
| mwCentralNoticeBanner | 2.326 s |
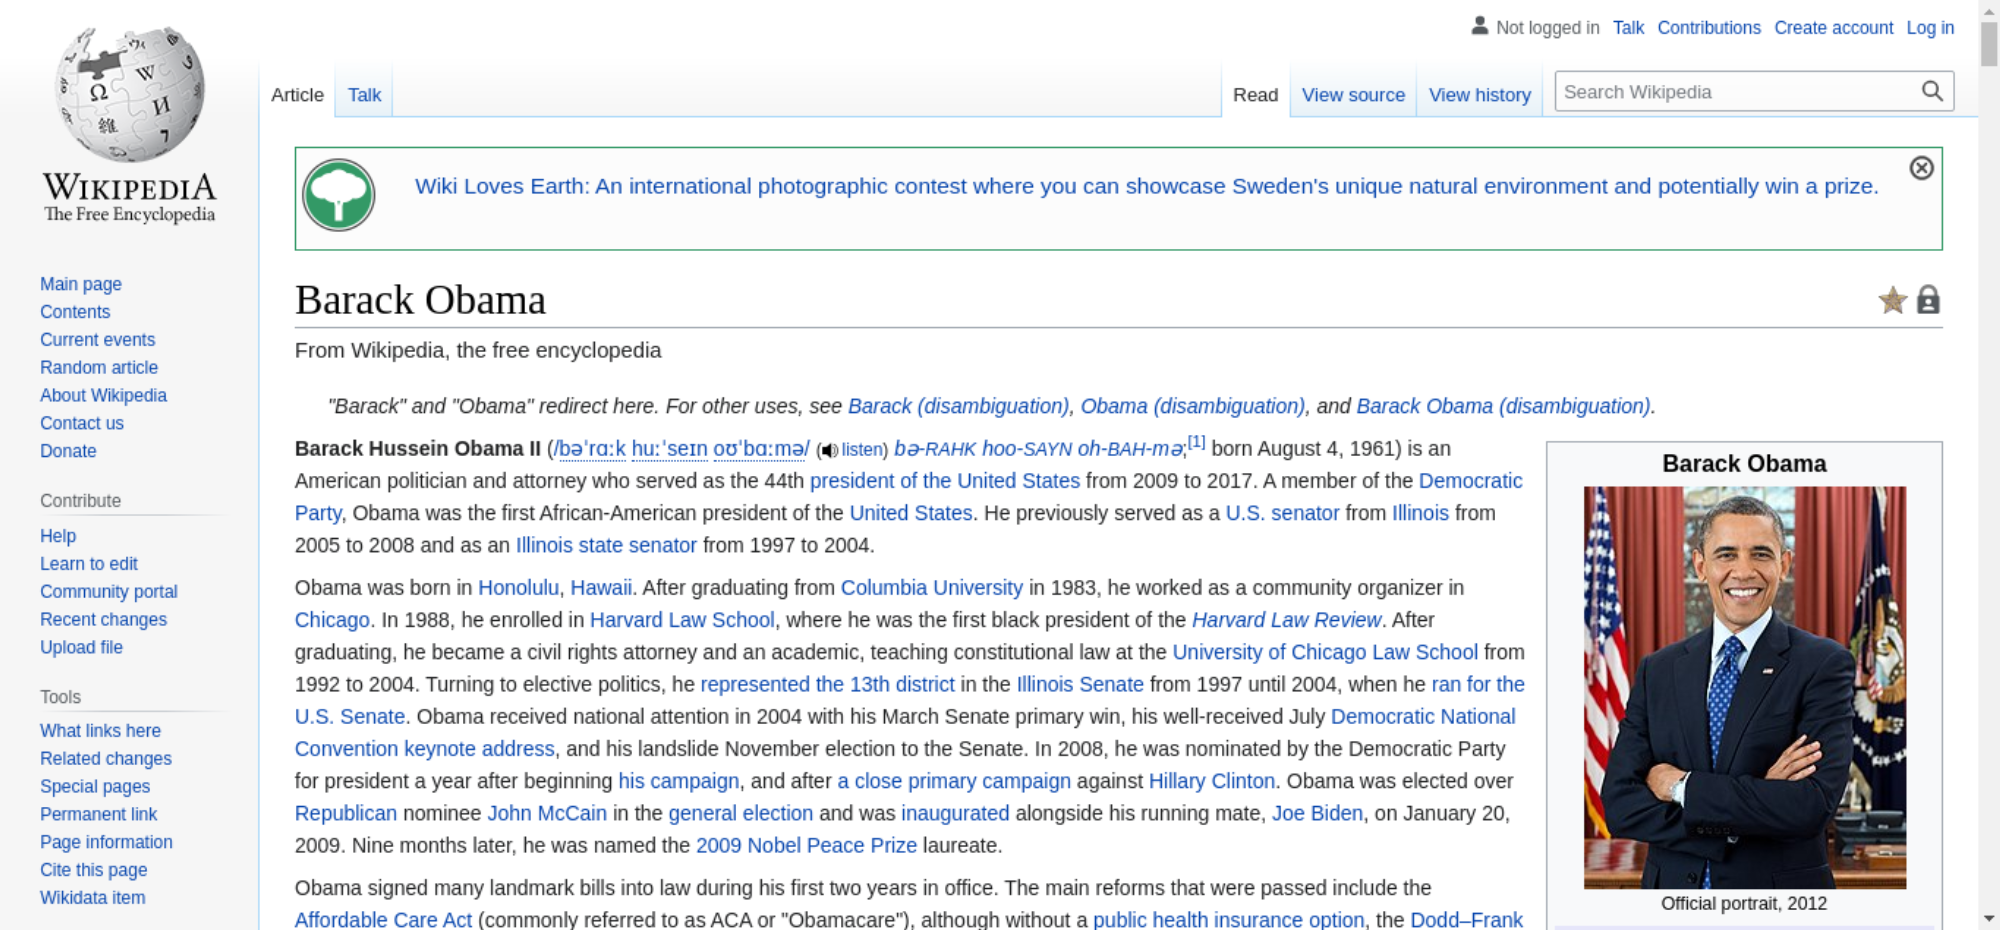
When in time the page main content is rendered (collected using the Largest Contentful Paint API). Read more about Largest Contentful Paint.
| Element type | P |
| Element/tag | <p></p> |
| Render time | 556 ms |
| Load time | 0 ms |
| Size (width*height) | 161472 |
| DOM path | |
| div#content > div#bodyContent > div#mw-content-text > div:eq(0) > p:eq(2)> div#content > div#bodyContent > div#mw-content-text > div:eq(0) > p:eq(2)> | |
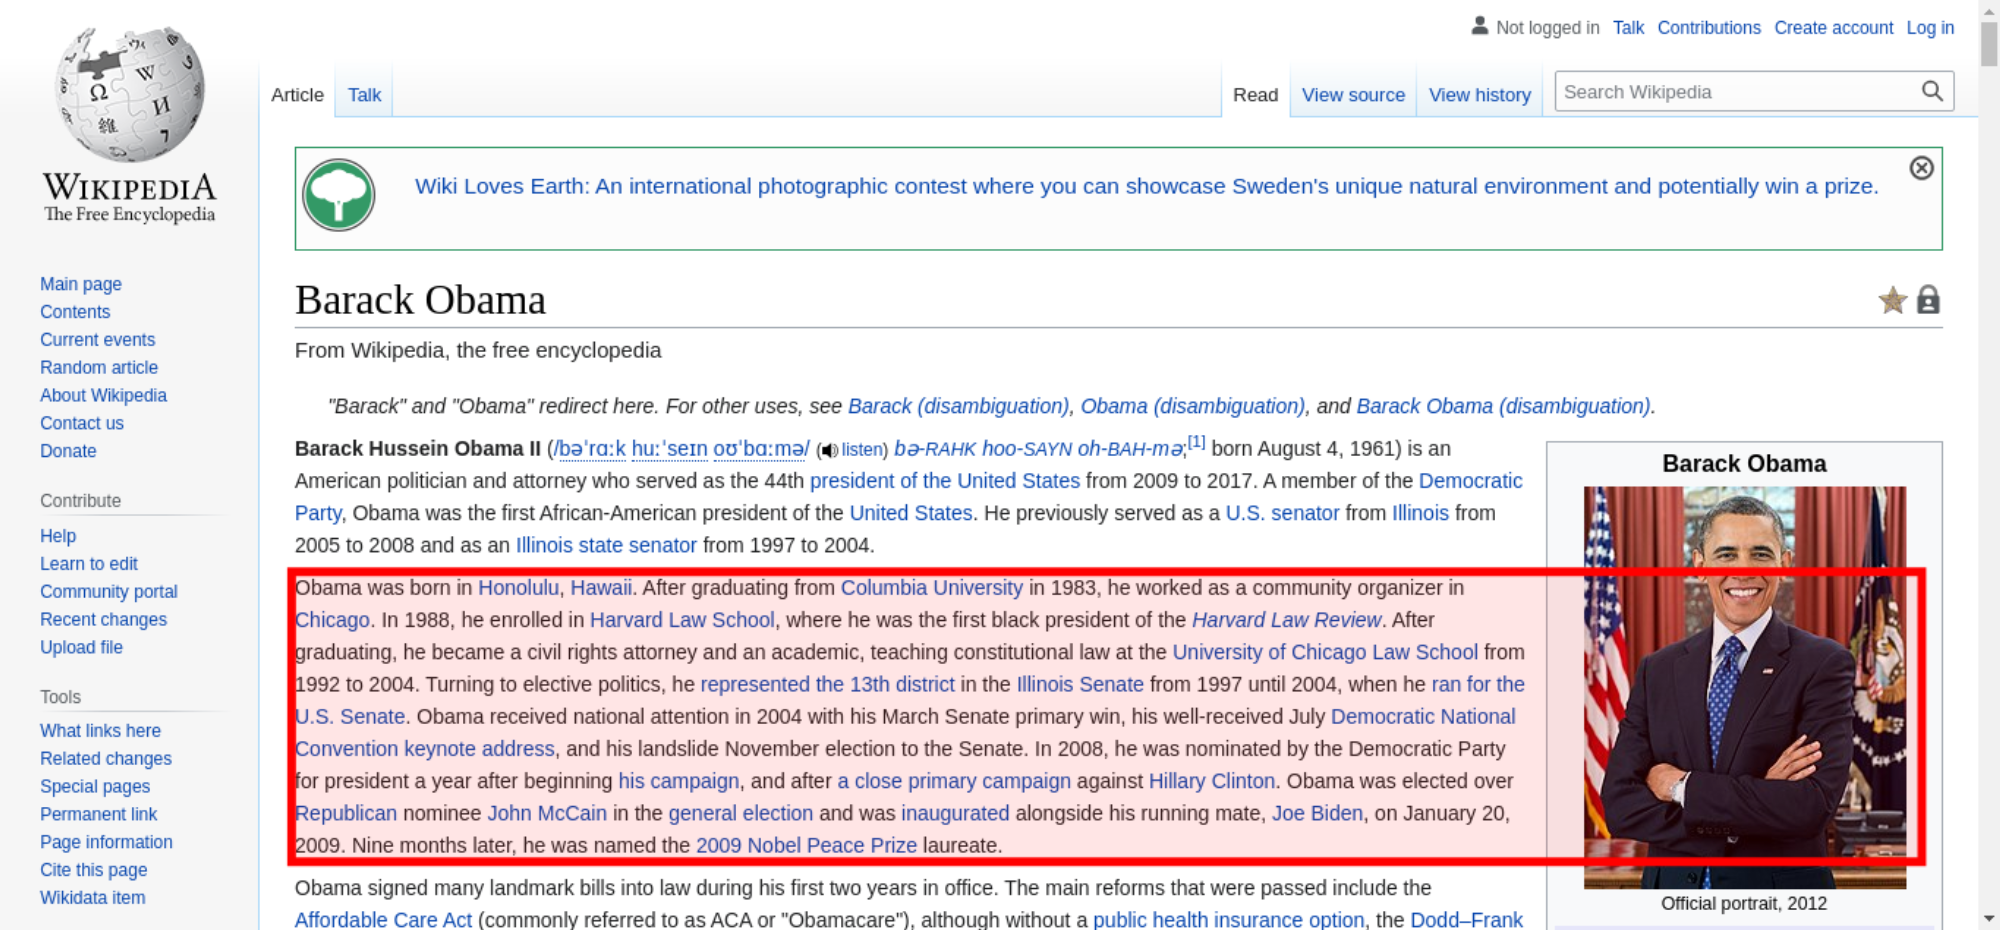
The largest contentful paint is highlighted in the image. If no element is highlighted the element was removed before the screenshot or the LCP API couldn't find the element.
0.04439 cumulative layout shift collected from the Cumulative Layout Shift API.
These HTML elements contribute most to the Cumulative Layout Shifts of the page. The higher score, the more layout shift.
| Score | HTML Element |
|---|---|
| 0.04424 | <h1 id="firstHeading" class="firstHeading"></h1>,<div id="bodyContent"></div>,<div id="mw-content-text" class="mw-body-content mw-content-ltr" lang="en" dir="ltr"></div> |
| body > div#content > h1#firstHeading,body > div#content > div#bodyContent,body > div#content > div#bodyContent > div#mw-content-text | |
| 0.00016 | |
| body > div#content > div#siteNotice > div#centralNotice > div:eq(0) > div:eq(1) > center > span > a > #text | |
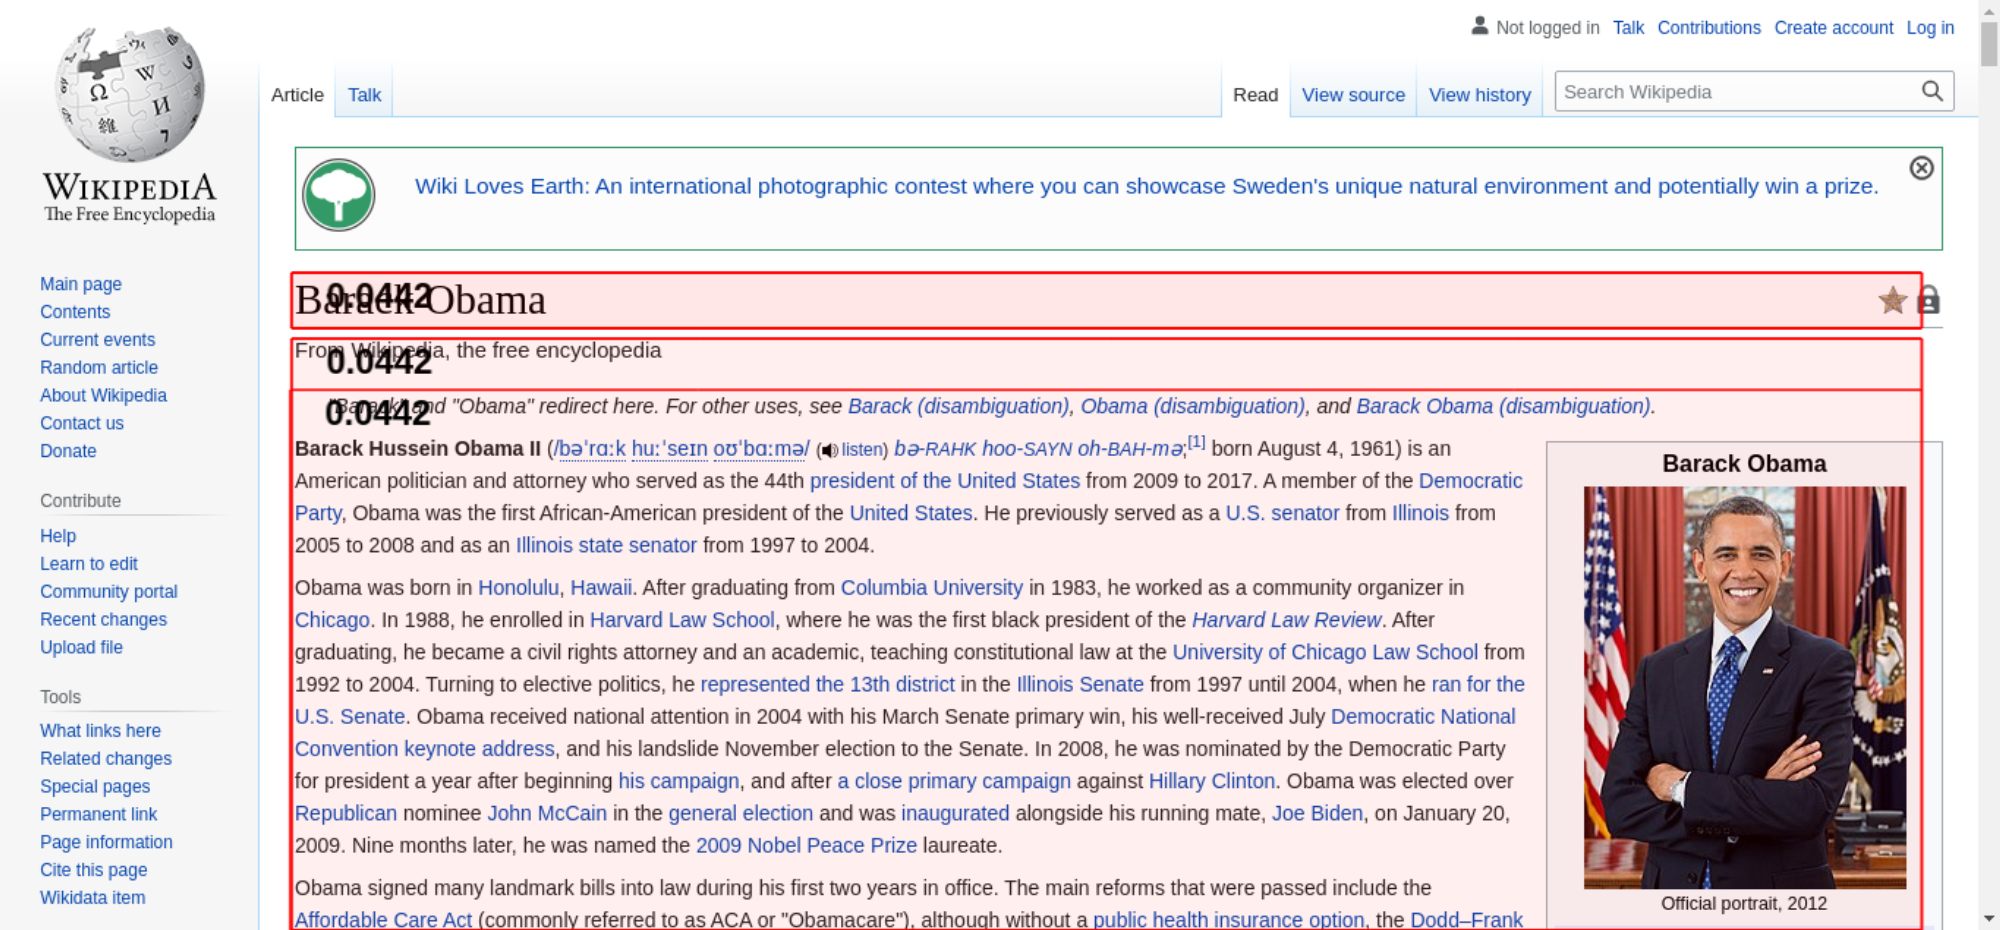
The elements that have shifted place is highlighted in the image (that have a higher value than 0.01). If the element shifted outside of the viewport, you will not see it there. It can be hard to understand what content that has shifted, if that's the case, checkout the video or the filmstrip of the run.
| name | duration | description |
|---|---|---|
| cache | 0 | hit-front |
| host | 0 | cp3058 |
There are no custom configured scripts.
There are no custom extra metrics from scripting.
| name | value |
|---|---|
| AudioHandlers | 0 |
| Documents | 13 |
| Frames | 13 |
| JSEventListeners | 2065 |
| LayoutObjects | 27521 |
| MediaKeySessions | 0 |
| MediaKeys | 0 |
| Nodes | 39092 |
| Resources | 97 |
| ContextLifecycleStateObservers | 28 |
| V8PerContextDatas | 1 |
| WorkerGlobalScopes | 0 |
| UACSSResources | 0 |
| RTCPeerConnections | 0 |
| ResourceFetchers | 13 |
| AdSubframes | 0 |
| DetachedScriptStates | 0 |
| ArrayBufferContents | 0 |
| LayoutCount | 24 |
| RecalcStyleCount | 26 |
| LayoutDuration | 437 |
| RecalcStyleDuration | 299 |
| DevToolsCommandDuration | 9 |
| ScriptDuration | 457 |
| V8CompileDuration | 6 |
| TaskDuration | 2339 |
| TaskOtherDuration | 1132 |
| ThreadTime | 2 |
| ProcessTime | 3 |
| JSHeapUsedSize | 5104136 |
| JSHeapTotalSize | 6340608 |
| FirstMeaningfulPaint | 556 |
How the page is built.
| Summary | |
|---|---|
| HTTP version | HTTP/2.0 |
| Total requests | 105 |
| Total domains | 4 |
| Total transfer size | 1.3 MB |
| Total content size | 3.1 MB |
| Responses missing compression | 10 |
| Number of cookies | 2 |
| Third party cookies | 0 |
| Requests per response code | |
|---|---|
| 200 | 105 |
| Content | Header Size | Transfer Size | Content Size | Requests |
|---|---|---|---|---|
| html | 0 b | 280.3 KB | 1.5 MB | 1 |
| css | 0 b | 13.8 KB | 59.8 KB | 2 |
| javascript | 0 b | 232.6 KB | 815.0 KB | 7 |
| image | 0 b | 754.2 KB | 738.3 KB | 82 |
| svg | 0 b | 9.7 KB | 19.5 KB | 12 |
| favicon | 0 b | 1.2 KB | 2.7 KB | 1 |
| Total | 0 b | 1.3 MB | 3.1 MB | 105 |
| Domain | Header Size | Transfer Size | Content Size | Requests |
|---|---|---|---|---|
| en.wikipedia.org | N/A | 543.2 KB | 2.4 MB | 21 |
| upload.wikimedia.org | N/A | 747.1 KB | 732.7 KB | 82 |
| login.wikimedia.org | N/A | 451 B | 236 B | 1 |
| meta.wikimedia.org | N/A | 944 B | 1.8 KB | 1 |
| type | min | median | max |
|---|---|---|---|
| Expires | 0 seconds | 0 seconds | 1 year |
| Last modified | 42 seconds | 2 years | 8 years |
| Content | Transfer Size | Requests |
|---|---|---|
| html | 0 b | 0 |
| css | 0 b | 0 |
| javascript | 19.5 KB | 1 |
| image | 2.7 KB | 2 |
| font | 0 b | 0 |
| svg | 1.2 KB | 2 |
| favicon | 1.2 KB | 1 |
| Total | 24.6 KB | 6 |
Includes requests done after onLoad.
| Content | Transfer Size | Requests |
|---|---|---|
| html | 0 b | 0 |
| css | 0 b | 0 |
| javascript | 19.5 KB | 1 |
| image | 2.7 KB | 2 |
| font | 0 b | 0 |
| svg | 1.2 KB | 2 |
| favicon | 1.2 KB | 1 |
| Total | 24.6 KB | 6 |
Download the Chrome trace log and drag and drop it into Developer Tools / Performance in Chrome.
Collected using the Long Task API. A long task is a task that take 50 milliseconds or more.
| Type | Quantity | Total duration (ms) |
|---|---|---|
| Total Blocking Time | 407 | |
| Max Potential First Input Delay | 205 | |
| Long Tasks before First Paint | 1 | 123 |
| Long Tasks before First Contentful Paint | 1 | 123 |
| Long Tasks after Load Event End | 1 | 81 |
| Total Long Tasks | 13 | 1130 |
| name | startTime | duration | containerId | containerName | containerSrc | containerType |
|---|---|---|---|---|---|---|
| unknown | 381 | 123 | window | |||
| unknown | 993 | 51 | window | |||
| self | 1115 | 65 | window | |||
| self | 1190 | 60 | window | |||
| unknown | 1262 | 56 | window | |||
| self | 1347 | 61 | window | |||
| unknown | 1419 | 76 | window | |||
| self | 1511 | 117 | window | |||
| unknown | 1644 | 69 | window | |||
| unknown | 1852 | 97 | window | |||
| self | 2058 | 205 | window | |||
| self | 2355 | 69 | window | |||
| self | 2532 | 81 | window |
Calculated using Tracium.
| Categories (ms) | |
|---|---|
| parseHTML | 120 |
| styleLayout | 738 |
| paintCompositeRender | 488 |
| scriptParseCompile | 7 |
| scriptEvaluation | 453 |
| garbageCollection | 51 |
| other | 496 |
| Events (ms) | |
|---|---|
| RunTask | 438 |
| Layout | 437 |
| UpdateLayerTree | 414 |
| V8.Execute | 330 |
| UpdateLayoutTree | 301 |
| ParseHTML | 117 |
| V8.HandleInterrupts | 100 |
| Paint | 51 |
| CompositeLayers | 18 |
| BlinkGC.LazySweepInIdle | 15 |
| Tool/domain | Time (ms) |
|---|---|
| en.wikipedia.org | 456.3 |
Third party requests categorised by Third party web.
Calculated using (.*wikipedia.*||.*wikimedia.*) (use --firstParty to configure).
| Content | Header Size | Transfer Size | Content Size | Requests |
|---|---|---|---|---|
| html | 0 b | 280.3 KB | 1.5 MB | 1 |
| css | 0 b | 13.8 KB | 59.8 KB | 2 |
| javascript | 0 b | 232.6 KB | 815.0 KB | 7 |
| image | 0 b | 754.2 KB | 738.3 KB | 82 |
| font | 0 b | 0 b | 0 b | 0 |
| svg | 0 b | 9.7 KB | 19.5 KB | 12 |
| favicon | 0 b | 1.2 KB | 2.7 KB | 1 |
| Total | N/A | 1.3 MB | 3.1 MB | 105 |
| Content | Header Size | Transfer Size | Content Size | Requests |
|---|---|---|---|---|
| html | 0 b | 0 b | 0 b | 0 |
| css | 0 b | 0 b | 0 b | 0 |
| javascript | 0 b | 0 b | 0 b | 0 |
| image | 0 b | 0 b | 0 b | 0 |
| font | 0 b | 0 b | 0 b | 0 |
| Total | N/A | N/A | N/A |